27.02.2025
2024 Liquid Alternatives strategies give a 9.26% annual return. Best result since the study was launched
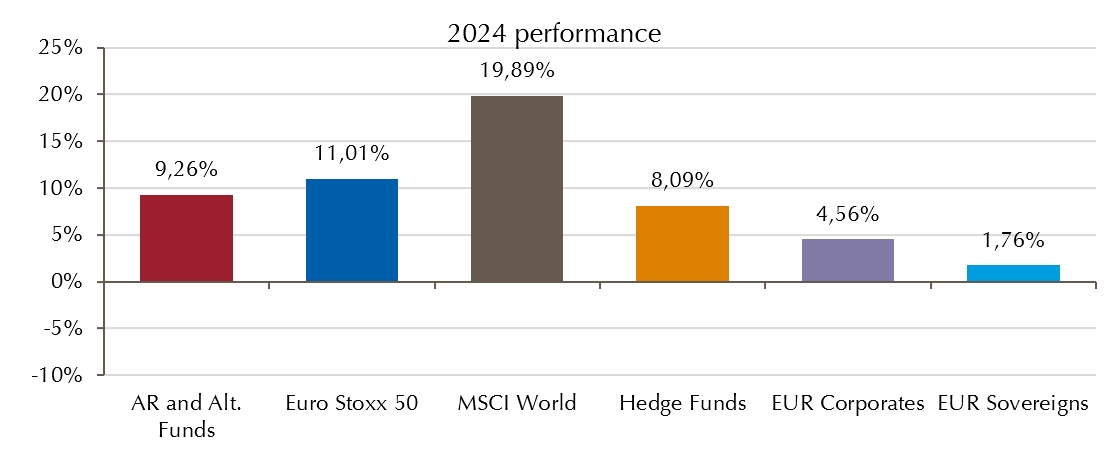
2024 marks an extraordinary success for Liquid Alternatives in Germany. With a performance of 9.26%, the asset class saw the best return since the study was launched in 2008, positioning itself close to European equities (+11.01%) and well ahead of EUR bonds (corporates: 4.56%). The UCITS hedge fund strategies also outperformed unregulated hedge funds (8.09%). Thebroad basis of success is remarkable: 88.5% of all funds posted a positive performance. The asset class was particularly strong in terms of risk control – the maximum drawdowns remained in single digits for almost all strategies, with Absolute Return Bond and Alternative Credit Focus particularly convincing with very moderate drawdowns of -2.9% and -2.7%, respectively, combined with strong performance. The quality of risk management is also reflected in the Sharpe ratio: 62.4% of all funds achieved a positive metric, with one fifth achieving a ratio of 1 or more.
A significant turnaround was evident in cash flows in the second half of 2024. After record outflows of EUR 35.1 billion in 2023, net outflows fell to only EUR 4.29 billion in 2024. While EUR 6.37 billion was lost in the half-year, the second half was positive for the first time. Seven out of 14 strategies recorded positive net cash flows led by Absolute Return Bond with inflows of EUR 4.7 billion, resulting in a 5 percentage point increase in market share to 21%. Alternative fixed income strategies remain the largest group in the market at 30%.
The investment behaviour of institutional and retail investors showed striking differences in 2024. Institutional investors, who accounted for more than 50% of market volume for the first time, prefer crisis-resistant investment strategies with lower drawdowns, in particular alternative fixed income strategies and equity market neutral. For them, the focus is on the diversifying contribution to the portfolio. Retail investors, on the other hand, are more risk-prone and rely more strongly on strategies with higher equity risk, particularly equity leveraged.
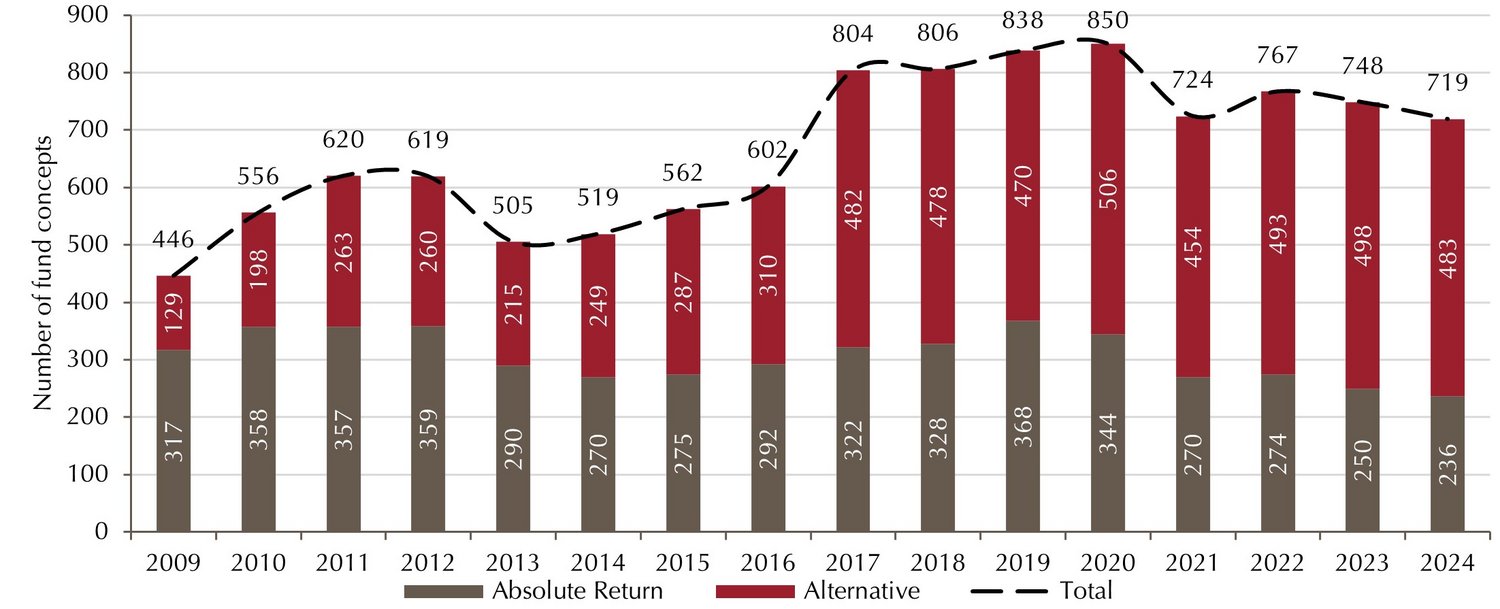
Number of funds decline slightly
2024 shows a moderate consolidation in the Liquid Alternatives market. The number of funds decreased from 748 to 719 funds (-3.9%) compared to the previous year. This development affected both absolute return (-5.6%) and alternative (-3.0%) concepts. However, the positive momentum within the year is noteworthy: The number of funds initially fell to 708 by mid-year. Eleven funds were added in the second half of the year. The absolute level thus corresponds approximately to the post-coronavirus year 2021, with the ratio of two-thirds alternatives to one-third absolute return remaining nearly unchanged.
Number of funds declines
×
![]()
Market volume recovery
The market volume was positive despite slightly negative net cash flows (EUR -4.29 billion). Compared with the previous year, it rose by EUR 11.6 billion (+5.0%) to EUR 243.2 billion. Volume growth is therefore mainly driven by the strong fund performance (page 7). Absolute Return funds in particular increased their volume significantly (+7.8% / EUR +6.1 billion), while Alternatives posted a 3.6% (EUR +5.5 billion) increase.
Market volume picking up again

×
![]()
Institutional share classes dominate segment for the first time
Institutional volumes in the asset class have reached a new post-2019 high. Compared with 2023, their volume increased by EUR 28.7 billion to EUR 125.6 billion (+29.6%).* Both sub-segments benefited from this development: The absolute return volume rose sharply by EUR 30.8 billion to EUR 44.6 billion (44.9%), while alternative concepts also rose significantly from EUR 66.2 billion to EUR 81.1 billion (22.5%). With 51.7% of the asset class, the institutional share classes for the first time account for more than half of the market volume.
This trend suggests that institutional investors are once again gaining confidence in the asset class. They take the opportunity to expand and diversify their strategic asset allocation through alternative investment approaches alongside traditional long-only investments in equities and bonds. Given the sometimes very high valuations of global equities and the increased likelihood of crises expected by many experts, investors have shifted more towards alternative investment segments with higher downside protection.
*The net outflows of institutional share classes were just over EUR 2 billion. The increase in volume is due to good market performance and reclassifications in the universe by data supplier LSEG Lipper.
Institutional volume rises to record levels

×
![]()
Large funds continue to dominate the market
The landscape has hardly changed compared to our previous analysis, with the top 5% of funds managing almost twice as much capital as the bottom 80%. As a result, the market continues to be dominated by a few large providers. This tendency becomes even more pronounced when dividing the market into its upper and lower halves, with the upper half of funds accounting for 94.6% of assets in the segment, while the lower half of funds once again manage barely 5% of all assets.
Top 5% of funds account for 45% of total market volume

×
![]()
A look at the size of each fund completes the picture: 93.1% of all funds manage less than EUR 1 billion and 83.7% manage less than EUR 500 million. At the other end of the spectrum is a small group of funds with assets under management of more than EUR 4 billion. The concentration among the largest providers is particularly noteworthy: For example, the top 5% of funds have a fund volume of more than EUR 1 billion without exception.
Market share: Absolute Return Bond takes the lead
In 2024, there was a significant shift in market distribution between strategies: With a market share of 21.4% (previous year: 16.1%), Absolute Return Bond took the lead among Alternative Multi Strategies. This came to a share of 19.0%, close to the previous year’s level (18.9%). The remaining segments were broadly stable compared to the first half of the year and the previous year. The continued strong position of alternative fixed income strategies remains noteworthy: Together, Absolute Return Bond and Alternative Credit Focus have a market share of around 30%.
The three largest strategies represent more than half of assets in the asset class

×
![]()
One in three funds on the market for more than ten years
The age structure of the fund universe shows a high degree of continuity: One third of the funds are under 5 years old, between 5 and 10 years old and over 10 years old. This speaks for a fund universe with a healthy market structure that is not only based on newly launched funds.
Liquid Alternatives scores with strong performance
Liquid Alternatives reached a historic milestone in 2024 with a performance of 9.26%: This was the best return since the study was launched in 2008, well above the previous peak of 6.71% in 2021. The broad basis of success is remarkable: 88.5% of all funds posted a positive performance in 2024. With this performance, Liquid Alternatives positioned close to European equities and well ahead of EUR bonds, which tended to be more subdued in the face of uncertain central bank policy and uncertain inflation. Unregulated hedge funds also underperformed their UCITS-regulated counterparts. Only global equities significantly outperformed, driven by the strong US performance (S&P 500 at 25.02%) and the Magnificent 7 in particular.
Challenge to equities: Liquid Alternatives 2024
×
![]()
Strongest annual performance since 2021 high

×
![]()
Liquid Alternative Strategies achieved their best year-to-date performance in 2021. But even in the supposedly weak capital market years, the asset class has been convincing. In 2022, Liquid Alternatives were slightly in the losing zone with an average performance of -1.49%, but delivered far better performance than equities, bonds and unregulated hedge funds. The year was marked by a rapid rise in interest rates and emerging recession fears, and even investors in Euro government bonds suffered losses of -18.44%. Liquid Alternatives, with their often very flexible orientation, were less dependent on the direction of the market in this extreme environment and were able to successfully evade the general strongly negative trend.
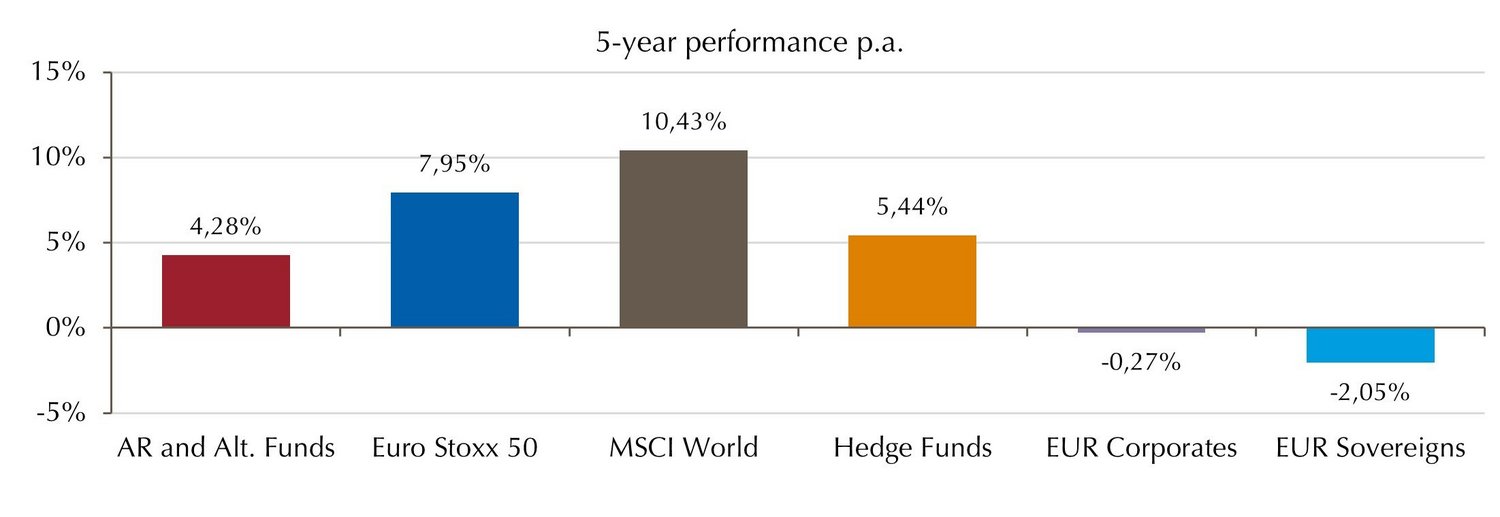
Long-term performance still ahead of bonds
Over three and five years, the asset class continues to underline its diversifying properties, while bonds continue to suffer from the price losses of previous years.
Liquid Alternatives exhibit solid long-term return

×
![]()
×
![]()
Significantly lower returns over the long term than for equities and bonds
Looking at the maximum losses over five years underscores the stability of Liquid Alternatives. With the exception of the two leveraged ones, all strategies have significantly lower maximum losses than a broadly diversified equity universe. This was particularly evident during the coronavirus shock on 23 March 2020, when the MSCI World suffered a maximum loss of 33.32%. Liquid Alternatives strategies have significantly limited these setbacks, with Alternative Equity Market Neutral the most resilient through the crisis with a maximum loss of only 13.6% in 2020.
Liquid Alternatives are also competitive compared to Euro bonds: Nine out of the 14 categories posted lower maximum losses than the bond market over five years, with three other categories only slightly higher. Another exception is the leveraged strategies, whose risk profile is clearly different from the other strategies: Their maximum drawdowns are almost double that of global equities. This can severely strain investors’ nerves in phases, but is offset by the prospect of higher long-term returns.
Significantly lower maximum losses than in the MSCI World

×
![]()
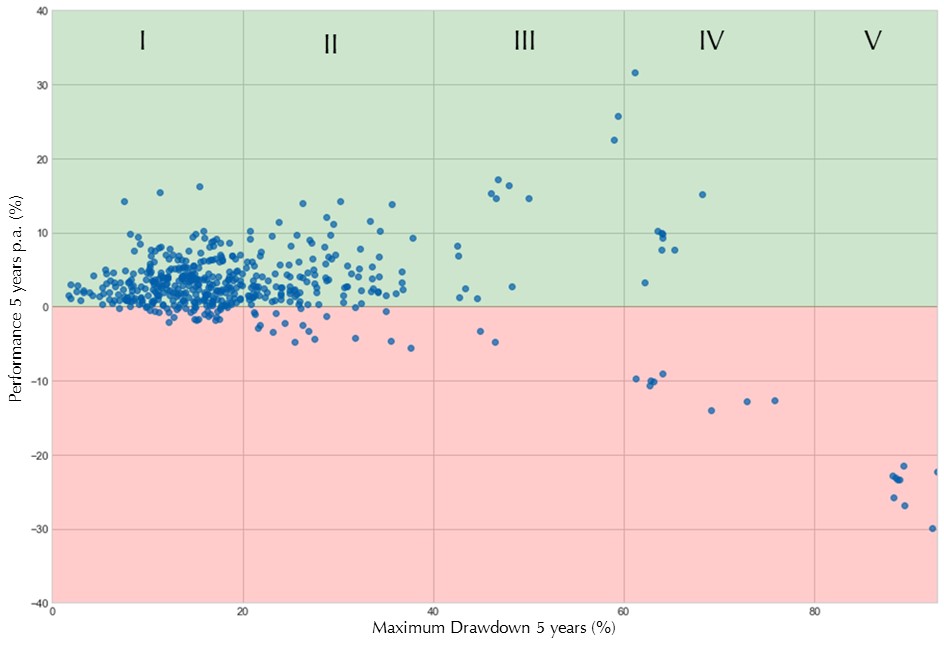
Long-term comparison: Good chance of return despite high maximum losses
The chart below shows a detailed analysis of the five-year performance relative to the maximum losses. Each data point represents a fund that is at least five years old. The successful risk control of the funds is striking: About two-thirds (64.2%) were able to limit their maximum drawdowns to below 20% over the five-year period. As the risk tolerance of the funds increases, as shown in columns II to V, spreads in both directions also increase. For example, around 27.3% of funds fall into the 20%-40% range – a magnitude that investors also know from the MSCI World (33.32%).
The situation is more critical for almost 10% funds in columns III, IV and V, which suffered losses of more than 40% due to poor risk management. The consequences of such high drawdowns are serious: While one half of these funds managed to achieve a positive five-year return despite the massive setbacks, the other half failed to recover, leading to significant negative returns. Overall, the positive picture prevails: 86.3% of all funds with at least five years of history have a positive performance.
Maximum drawdown and performance of individual funds
×
![]()
Sharpe ratio: Alternative Credit Focus far ahead
In the strong overall 2024, 62.4% of all funds achieved a positive Sharpe ratio, with one fifth of the funds achieving a Sharpe ratio of 1 or more. What is striking is the high concentration of high Sharpe ratios in certain categories: In Alternative Credit Focus, 60.4% of all funds had a Sharpe ratio above 1 – a clear demonstration of the excellent risk/return ratio of these strategies. This is also reflected in the top group: Among the top 20 funds with the best Sharpe ratio, the dominant funds are Alternative Credit Focus with 11 funds and Absolute Return Bond with 5 funds, which are driven by their high values due mainly to the combination of very low volatility and comparatively high returns.
Alternative Credit Focus delivers the best Sharpe ratios

×
![]()
Disclaimer: This document serves as a study for general information purposes and is not mandatory in accordance with investment law. The information presented does not constitute an invitation to buy or sell or investment advice. It does not contain all key information required to make important economic decisions and may differ from information and estimates provided by other sources, market participants or studies. We accept no liability for the accuracy, completeness or topicality of this study. All statements are based on our assessment of the present legal and tax situation. All opinions reflect the current views of the Company and can be changed without prior notice.
Lupus alpha Investment GmbH
Speicherstraße 49-51
D-60327 Frankfurt am Main
FURTHER INFORMATION